Creating mosaics, clipping and removing overlapping satellite images
Intro
This post describes ways to download, clip and join satellite images. The module sentinel-mosaic is
used throughout this blog post.
Background
There’s a number of satellites launched by the European Space Agency that take images of Earth which are then sent to ground stations and made publicly available through the Copernicus Open Access Hub and its respective API.
In this post we’re focusing mainly on the data
from Sentinel-2A and Sentinel-2B which were
designed for multiple purposes, one of those purposes being
land monitoring.
Here are some of the other satellites together with their launch dates and lifespans.
| satellite | launch date | end of lifespan |
|---|---|---|
Sentinel-2A | 2022-09-23 (7.25y lifespan) | |
Sentinel-2B | 2024-08-07 (7.25y lifespan) | |
Sentinel-3B | ||
Sentinel-3A | ||
Sentinel-5P | 2024-10-13 (7y) | |
Sentinel-6A (currently Sentinel-6 Michael Freilich, also known as Jason-CS) | 2026-04-21 (5.5 years) | |
Sentinel-6B |
The Copernicus Hub has a data retention policy. The policy states that data is readily available for download for the past 12 months, and older data downloads can be triggered and downloaded within 24 hours.
Setup
The following libraries are required. We’re installing them through the
conda package manager that comes with the Anaconda3 Python distribution.
There’s a Windows installer and a Linux installer.
The nice part about Anaconda3 is that they offer curated versions of these packages and their package manager takes care of external libraries as well. This makes the install much easier, so fixes like the one I had to do for Geopandas here when it was installed directly from PyPi are not necessary anymore.
| library | functionality | version |
|---|---|---|
raster image library | 1.2.1 | |
library that offers ways to query data collected from Sentinel through the Sentinel-2A and Sentinel-2B satellites | 0.14 | |
library that provides algorithms for processing vector data | 1.7.1 | |
library and set of tools that allows processing of geographical raster images from commandline. it’s also a dependency for other lirbaries. | 3.1.4 | |
library for transforming and querying geographical data frames (the data frames can contain metadata with polygon contours) | 0.9.0 | |
library for plotting data and drawing vectorial as well as raster data (mostly used for previews and summarizing data) | 3.4.0 | |
1.0.0 | ||
Anaconda distribution | Anaconda3 2020.11 | |
Python version used | Python 3.8.5 |
In order to install these, create a new environment, switch to it and then install the packages.
conda create -n e3 python=3.8.5
conda activate e3
conda config --add channels conda-forge
conda config --set channel_priority strict
conda install rasterio==1.2.1 sentinelsat==0.14 shapely==1.7.1
conda install gdal==3.1.4 geopandas==0.9.0 matplotlib==3.4.0 jupyter==1.0.0
Now also install the sentinel-mosaic package
pip install sentinel-mosaicSummary of the full algorithm
The steps are the following:
Reading the input data (the region of interest) from a GeoJSON file
Querying the Sentinel API to get the tiles that intersect the region of interest
Removing redundant granules I
Removing redundant granules II
Downloading the reduced set of granules (multiple zip archives stored on disk)
Unpacking the archives
Raster conversion
JP2OpenJPEG→GeoTiffJoining all the raster images
TCI(True Color) into one big imageReprojecting the image to
EPSG:4326Clipping the region of interest from the big image
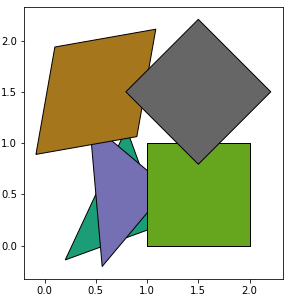
Removing redundant granules
The AOI(area of interest) itself might be located partially in one satellite image, and partially in another satellite image. In order to extract it, we need to pick certain granules (satellite images) that cover the AOI, download them, join them, and then cut out the AOI.
One of the problems I noticed when dealing with the metadata returned by the Sentinel API was that it returns overlapping granules. This is because the overlapping images were actually taken on different orbits of the satellites over nearly the same area.
Furthermore, here’s a small table describing the types of images that you can expect to get back:
| public | level | dimensions | disk space |
|---|---|---|---|
No | 25km x 23km | ? | |
No | 25km x 23km | ? | |
No | 25km x 23km | 27 MB | |
Yes | 100km x 100km | ||
Yes | 100km x 100km |
So in order to minimize the amount of data you download, we can decide which of the granules covering the area of interest we want to download (depending on the attributes of each granule). Reducing these images also helps later on with the other steps (the less images we’re joining/reprojecting, the less time it will take).
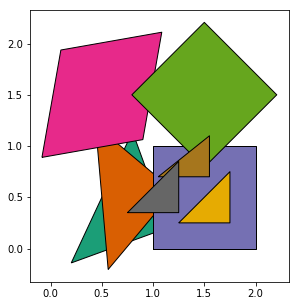
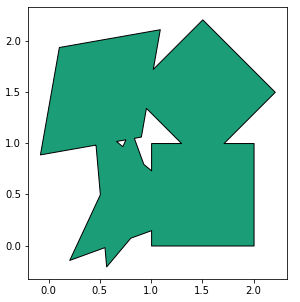
This algorithm goes through all polygons and adds them to union_poly
only if they’re not already contained in union_poly (in other words,
we’re only adding them to union_poly if they can increase the total area covered).
In the code below, ps is the set of polygons used as input.
1
2
3
4
5
6
7
8
9
union_poly = ps[0]
union_parts = [ps[0],]
for p in ps[1:]:
common = union_poly.intersection(p)
if p.area - common.area < 0.001:
pass
else:
union_parts.append(p)
union_poly = union_poly.union(p)
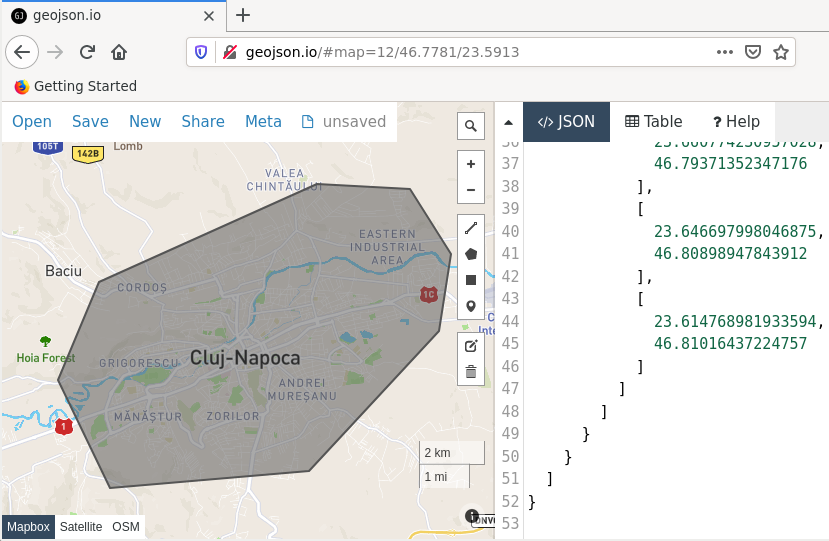
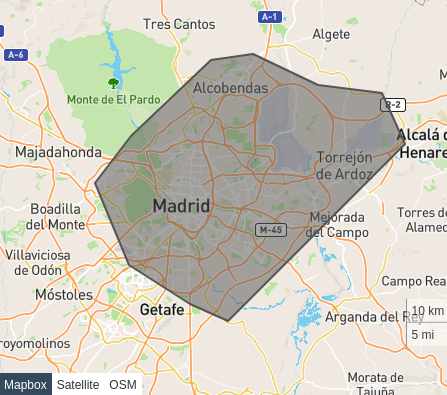
The area of interest
The area of interest is a polygon (you can draw one yourself on geojson.io) that describes the final area we want clipped from the granules. Here are two examples, one of Cluj-Napoca, and the other of Madrid.
Usage
After going through the setup described above, and defining an area of interest, you can run the entire algorithm like so:
python3.8 ./sentinel-toolbelt.py --auth_file auth.json --aoi_file ./sample_inputs/p12_madrid.geojson --dl_dir ./out/madrid/You can also use the --start_date and --end_date switches to only use images taken from a certain period.
The file auth.json has the following structure:
{
    "user": ".....",
    "pass": "....."
}
and you can get a username/password by creating an account here.
Results
The dates at which the images were taken will matter, because even though the adjacent images will match (and you can see this by looking at rivers or roads continuing from one image to next one), the colors can differ a lot if the images were taken in different seasons (for example one in autumn and one during winter).
Here are results from intermediary and final steps (you can zoom-in a lot, they’re very large):
| If you liked this article and would like to discuss more about custom software solutions feel free to get in touch at stefan.petrea@gmail.com. |