Polygon gridding using Geopandas and Shapely
Intro
This post will discuss some work involving maps I’ve helped a client with. The main goal of the project was collecting various datasets from web services.
One of those web services has an endpoint that receives as a parameter a series of points that define a polygon for which the API request is made (the response will be a series of resources that are located inside that polygon). The API supports pagination, so if the area of the polygon is too big, we’ll have to do additional requests for all the result pages.
Since the service is localized to a specific country, it would be possible to compute a bounding box for the country, and then partition that into small rectangles of fixed dimensions to cover the entire country.
But since the country surface is not of rectangular shape, this would mean a certain volume of useless requests (outside the country’s area), since some of those small rectangles will fall outside the country’s borders.
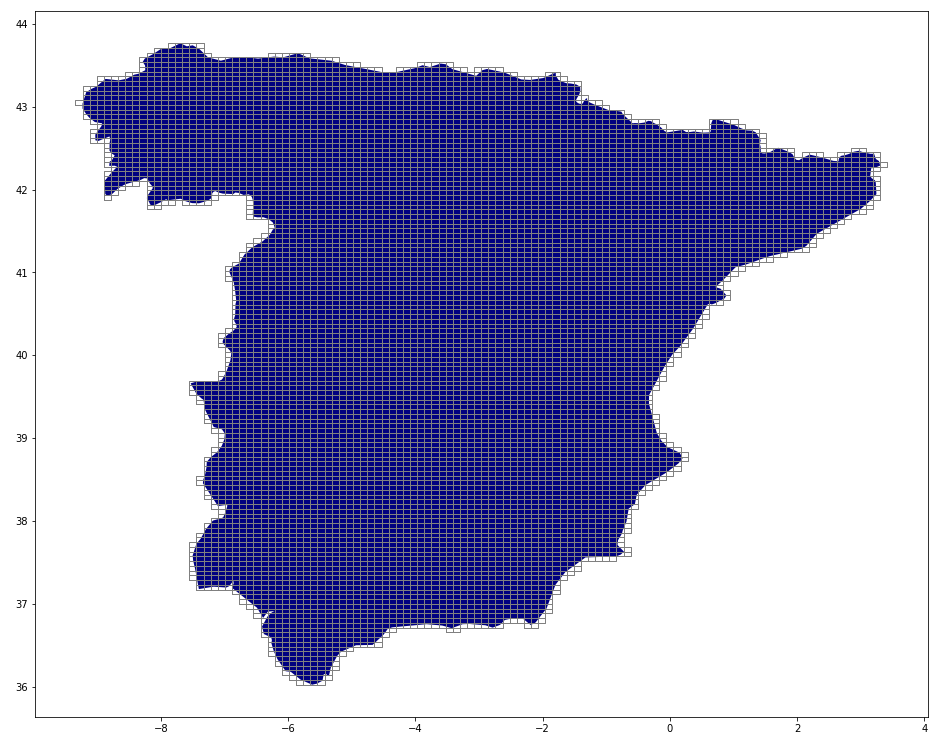
So we take a better route, and instead of the country’s bounding box, we partition the country’s area into rectangles of certain dimensions, and then we make API requests for each of those small rectangles.
Installing Geopandas and dependencies
Below is a set of steps that allows to build Geopandas and its dependencies.
The library proj needs to be installed. The proj-bin package in Debian/Ubuntu offers an old version
of the library, so we build a newer version (7.2.1) locally.
1
2
3
4
5
6
7
8
9
10
11
12
13
14
15
16
17
sudo apt-get install libspatialindex-dev
sudo apt-get install libtiff-dev
mkdir $HOME/sources/
cd $HOME/sources/
wget https://download.osgeo.org/proj/proj-7.2.1.tar.gz
tar xzvf proj-7.2.1.tar.gz
cd proj-7.2.1/
./configure
make
cd proj-7.2.1/src/
ln -s . bin/
PROJ_DIR=`pwd`/src PROJ_INCDIR=`pwd`/src PROJ_LIBDIR=`pwd`/src/.libs pip3 install --user pyproj
pip3 install --user rtree
pip3 install --user pygeos
Gridding the country’s area
We start out by telling pyproj the path to the data directory for proj, and defining a function
that will help with converting a Shapely Geometry object to a GeoDataFrame object that Geopandas
can plot later on.
1
2
3
4
5
6
7
8
9
10
11
12
13
14
15
16
17
18
19
import pyproj
pyproj.datadir.set_data_dir("/home/user/sources/proj-7.2.1/data")
import geopandas
from fiona.crs import from_epsg
import numpy as np
import sys
import shapely
import warnings
warnings.filterwarnings("ignore")
country_key = "Spain"
# Convert a shapely.geometry to a GeoDataFrame
def geom_to_gdf(g, label):
gdf = geopandas.GeoDataFrame()
gdf.crs = from_epsg(4326)
gdf.loc[0, 'geometry'] = g
gdf.loc[0, 'Location'] = label
return gdf
Next, we read a GeoJSON file with all boundaries for all countries, we turn that into a GeoDataFrame and we slice it to get the specific country we’re interested in. Since some countries are defined by a MULTIPOLYGON (composed of the mainland, as well as overseas regions), we get the largest of these regions(the mainland) and extract the underlying Shapely Geometry object.
1
2
3
4
5
6
7
8
def init_data():
global g_country
df = geopandas.read_file("/home/user/Downloads/custom.geo.json")
country_regions = df[df['admin'] == country_key].geometry.explode().tolist()
max_region = max(country_regions, key=lambda a: a.area)
g_country = max_region
init_data()
Then we’ll use a bounding box, and we create a grid using the country bounding box. We also want to have the cell width and height configurable.
We go over all the cells in the bounding box and we only retain those that intersect the country’s surface. Performing the intersection is much faster using Shapely objects than Geopandas GeoDataFrame objects.
1
2
3
4
5
6
7
8
9
10
11
12
13
14
15
16
17
18
19
20
gdf_country = geom_to_gdf(g_country, country_key + '_mainland')
ax = gdf_country.plot(markersize=.1, figsize=(16, 16), cmap='jet')
xmin, ymin, xmax, ymax= gdf_country.total_bounds
## real cell dimensions
cell_width = 0.0817750
cell_height = 0.0321233
grid_cells = []
for x0 in np.arange(xmin, xmax+cell_width, cell_width ):
for y0 in np.arange(ymin, ymax+cell_height, cell_height):
x1 = x0-cell_width
y1 = y0+cell_height
new_cell = shapely.geometry.box(x0, y0, x1, y1)
if new_cell.intersects(g_country):
grid_cells.append(new_cell)
else:
pass
Then we plot the country’s polygon as well as all the cells that intersect it. This allows us to visually check if everything looks right:

Finally, we write out the coordinates of every cell in a file, so our scraper can use these coordinates in order to make API requests.
1
2
3
4
5
6
7
8
9
10
11
12
cell_df = geopandas.GeoDataFrame(grid_cells, columns=['geometry'], crs=from_epsg(4326))
cell_df.plot(ax=ax,facecolor="none", edgecolor='grey')
# preparing the output
with open("cells_" + country_key + ".txt", "w") as f:
for cell in grid_cells:
# last point is excluded (since it's the same as the 1st)
bounds = []
for x,y in cell.exterior.coords[:-1]:
x1,y1 = float('%.6f'%(x,)) , float('%.6f'%(y,))
bounds.append([x1,y1])
f.write(str(bounds) + "\n")
Writing the scraper
We now use the file cells_Spain.txt that we’ve generated in the previous section, as input
for our scraper.
We can write the scraper in many different ways(Scrapy would be one way), but using GNU Parallel and Bash is very effective in this case.
1
2
3
4
5
6
7
8
9
10
11
12
13
14
15
16
17
18
19
20
#!/bin/bash
fetch_page() {
num="$1"
bounds="$2"
echo "$num"
set -x
curl \
-H 'Referer: https://www.website.com/api' \
-H 'content-type: application/json' \
-H 'Origin: https://www.website.com' \
--data-raw '{"bounds": '"$bounds"'}}' \
'https://api.website.com/' > data/$num.json
set +x
}
mkdir data
export -f fetch_page
cat cells_Spain.txt | parallel --no-notice -k -j2 'fetch_page {#} {}' :::
| If you liked this article or if you have feedback and would like to discuss more about data collection pipelines and scraping feel free to get in touch at stefan.petrea@gmail.com. |